MAGYC
Multi wAvelenght GalaxY Custers
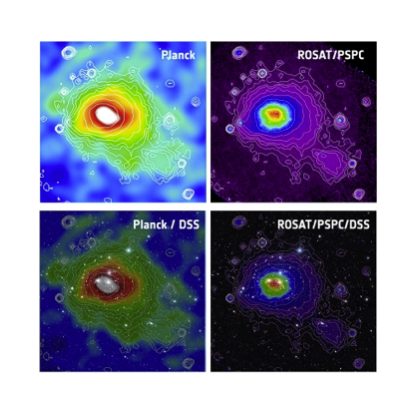
Find information about clusters at your given position: cross match with cluster catalogs, poststamps of Xray and SZ maps, optical and IR image and redshift estimate from Wazp cluster finder.
L3S develops and maintain an expertise in high level analysis of large scale structures, by producing analysis pipelines, distributing data in databases, and offering visualisation of added value products, using uptodate technics from VO and machine learning.
L3S is a Action Nationale d'Observation du centre d'Expertise Régional SO5 des Observatoires des Sciences de l'Univers Paris Saclay ( OSUPS) , de la Cote d'Azur (OCA) et d'Aix Marseille (Pytheas).
L3S delivers high level products from Planck data like SZ maps in SZDB, polarised frequency, galactic dust and CO maps made with in-house technics in P-maps. You can also access the latest SROLL maps released in temperature and polarisation, in healpix format, derived products obtained from neural network approach. The IRAS all sky survey has also been reprocessed to correct for residual instrumental effects and photometric uncertainties. The Improved Reprocessing of the IRAS Survey (IRIS) is also available.

Multi wAvelenght GalaxY Custers
Find information about clusters at your given position: cross match with cluster catalogs, poststamps of Xray and SZ maps, optical and IR image and redshift estimate from Wazp cluster finder.
SZ database
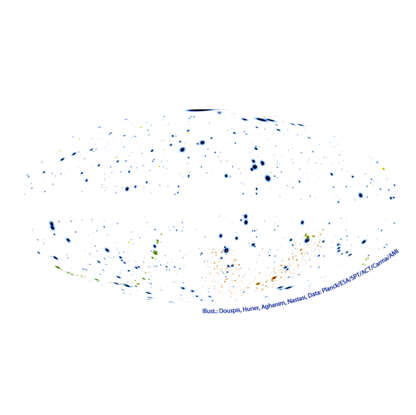
Access all info from SZ observations and simulations: cluster catalogues, maps, spectra. Query the database of 2690 SZ clusters for Planck, SPT, ACT cluster properties.
Planck CMB and submm maps
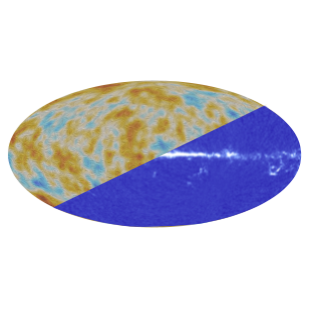
Find the lastest SROLL Planck CMB polarised maps, as well as extragalactic maps built from Planck data, and IRIS maps from IRAS survey.
Herschel Database
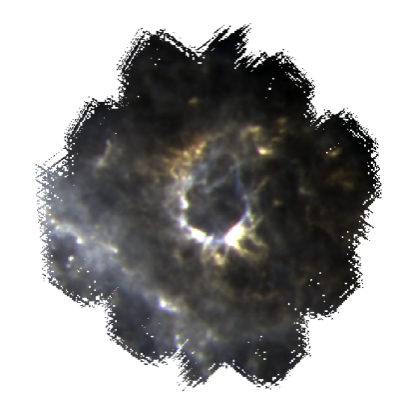
HESIOD provides high level data observed by Herschel, analysed using SUPREME and Sanepic. The database provides images and source catalogs.
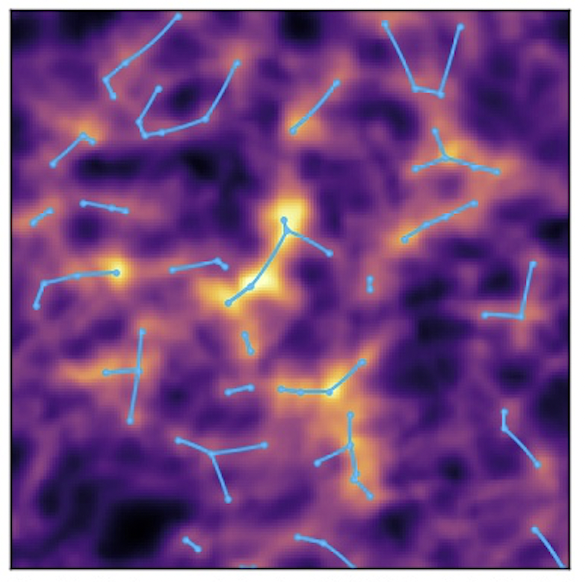
Cosmic Filament catalogues
Download cosmic filament catalogues obtained with DisPerSe on SDSS data
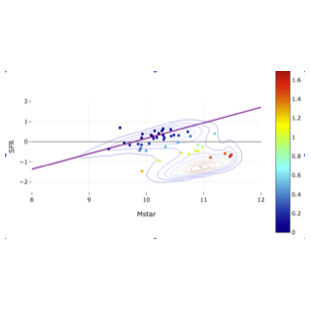
Galaxie Properties from ML
Visualize the distribution in 3D of galaxies in SDSS around you prefered direction and see their stellar masses and star fomation rate to derive their type (Red and Dead, Green Valley, Main sequence) in an interactve way.

Coming soon
L3S is actively developing and maintaining a large class of software dedicated to data analysis and interpretation :